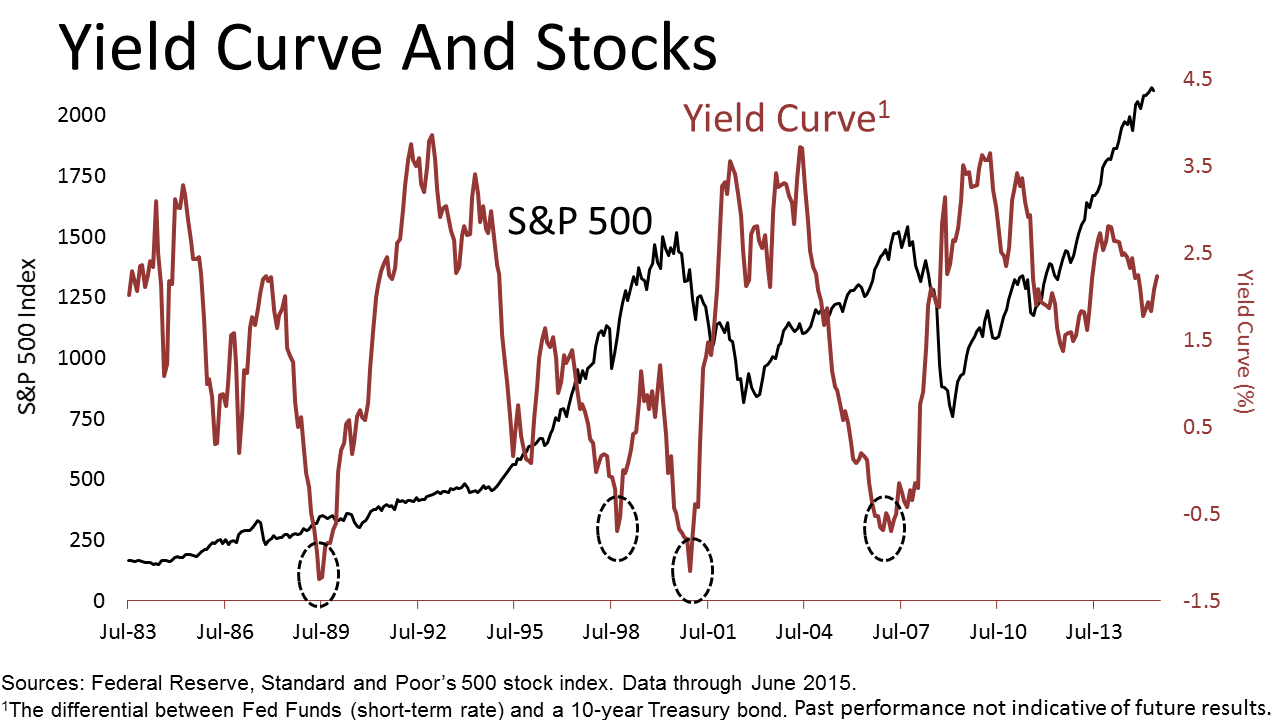
| It's been 10 days since the 1,000 point plunge of August 24 and the world has not come undone. After the day of that dramatic plunge on Monday, August 24, the Standard & Poor's 500 closed last week with a slight gain. This past week, we were not as fortunate. The S&P 500 ended down 3.4%. It was the second-worst weekly drop of the year. The index is down nearly 10% from its peak of 2,130.82 reached May 21. Should you worry? In times when the stock market is volatile, it's important to stay focused on fundamentals driving the economy, and the fundamentals have not changed. A correction won’t make consumers cut back on back-to-school spending. Economist Fritz Meyer, whose research we license to share with you, says, "Bear markets, declines of more than 20%, don't start until the Fed make it so, by flattening or investing the yield curve. The red line in this chart below represents the "yield curve," which is the differential between short-term rates and long-term yields. Since 1983, the yield curve showed a pattern important to investors now. When the differential has been large — when the red line is in the 2% or 3% range — it was a good time for stocks, which are represented by the Standard & Poor's 500 stock index. The yield curve is steep when the economy was robustly growing. Stocks, the black line, went up. Conversely, when the yield curve is small or negative — when the Fed has ratcheted short-term rates higher to converge with bond yields — the resulting flat or inverted yield curve has preceded recessions and stock market downturns. Because flat yield curves have led to recessions, they also have reliably signaled the onset of significant bear markets in stocks. Importantly, in the period since 1983 illustrated in the chart, above, there have been no significant stock market downturns without the yield curve first having first gone flat or inverted. "We're years away from a flat or inverted yield curve," says Meyer, an independent economist. As of Friday, September 4, the debate among market analysts was about when the Fed might begin raising interested rates and usher in a new phase in the economic cycle, of rising interest rates, a phase that is likely to take many years to unfold. A flat yield curve is likely to be years away. Stocks had a bad day Friday, even after the U.S. Labor Department announced at 8:30 a.m. that the unemployment rate had dropped to a seven-year low of 5.1% in August. Hiring slowed, however. It did not clarify uncertainty about when the first Fed rate hike would occur, and that was enough to trigger Friday's selloff. Earlier in the week, concerns about China’s slowing economy were blamed for stock prices weakening. However, weakness in China's economy and a correction of 10% or 20% in the U.S. stock market are unlikely to change the American consumer's ever-growing appetite for consumption of good and services. With 70% of all U.S. economic activity tied to consumer spending, the main engine of the economy is on track to drive earnings higher. If public companies deliver earnings as expected and no really bad, unexpected events occur, earnings are poised to continue to drive stock prices higher. The correction has made stocks more attractively priced. Volatility happens. But it is impossible to predict precisely what day a correction will come. That's why Modern Portfolio Theory (MPT) — a large body of work explored by financial economists in academia — is so valuable as an investment framework. MPT is the very opposite of timing the market, which is improbable to do repeatedly reliably over time. Past performance never a good indication of your future result, and nothing in this article should be taken as advice. No one can predict the future. But remembering economic fundamentals is important in times like these. If you would like to talk with us about these ideas and your personal financial future, please contact us. |