2016 is over and it was a year of major surprises.
In 2016, the Standard & Poor's 500 defied expectations by gaining 12.5% - outpacing its annual average return since 1926 of 9.5% by a three percentage point margin. It was yet another calendar year of strong U.S. stock returns, part of a bull run that began in April 2009.
And, lately especially, the surprises have been pleasant. Since the November 8 election of Donald J. Trump as the 45th U.S. President, which was a huge surprise, the average share price of America's largest 500 publicly-held companies repeatedly broke new records. What's more, the economy grew by 3.5% in 2016, better than almost anyone expected at the start of the year. This economic expansion, at 91 months, is still more than two years away from lasting longer than the 120-month expansion of the 1990s, the longest in modern U.S. history. It could keep going on. In fact, because of the great economic destruction wrought by The Great Recession, this recovery has been attenuated - with support of nearly dormant inflation. Recessions trigger bear markets, which is why the 2.4% growth rate expected in 2017 is good news. However, as shown in this chart, not every bear market was accompanied by a recession. You can have a correction in stock prices anytime, or even a bear market, even in economic expansions.
That's the main reason why staying diversified and committed to a long-term strategic plan is so important to achieving your goals over the long run. The slow but steady method for successful investing by broadly diversifying never is a star, which is worth noting at this very stage in the long bull market. As it always happens in a bull market, diversified portfolios are not keeping up with the returns on the S&P 500. By definition, a diversified portfolio must underperform the best-performing asset class in a portfolio.
So every time you hear about the great performance of the S&P 500, remember that you cannot compare the S&P 500 return to a diversified portfolio built for achieving long-term financial planning goals.
Precisely because of the kind of surprises seen in 2016, staying committed to a strategic investment plan based on diversification remains the best way to win the race in the long run.
The 16.8% return on high-yield bonds in 2016 is a perfect example of why diversification and rebalancing are so crucial. High yield bonds were the No. 2 performer among the 13 asset classes represented in this chart. It almost defies logic! High yield bonds are a fixed-income asset class, and the returns on fixed income, as represented by seven- to 10-year Treasury bonds, and municipals bonds, are among the worst of the 13 asset classes. Yet high-yield "junk" bonds returned nearly 100% more than their average annual return over the past five years of 8.5%. So don't lament not owning more stocks, because no one can reliably predict the next best asset class. Other important takeaways from this one-year picture is that Master Limited Partnerships were the No. 1 asset class for 2016, with a 21.5% return. Last year, they were hammered.
MLPs represent a new asset class that appeared in the last few years. Income investors suffered large setbacks a year ago in MLPs, but the business has recovered and they were the top of the heap in 2016. Again, that's quite a surprise. 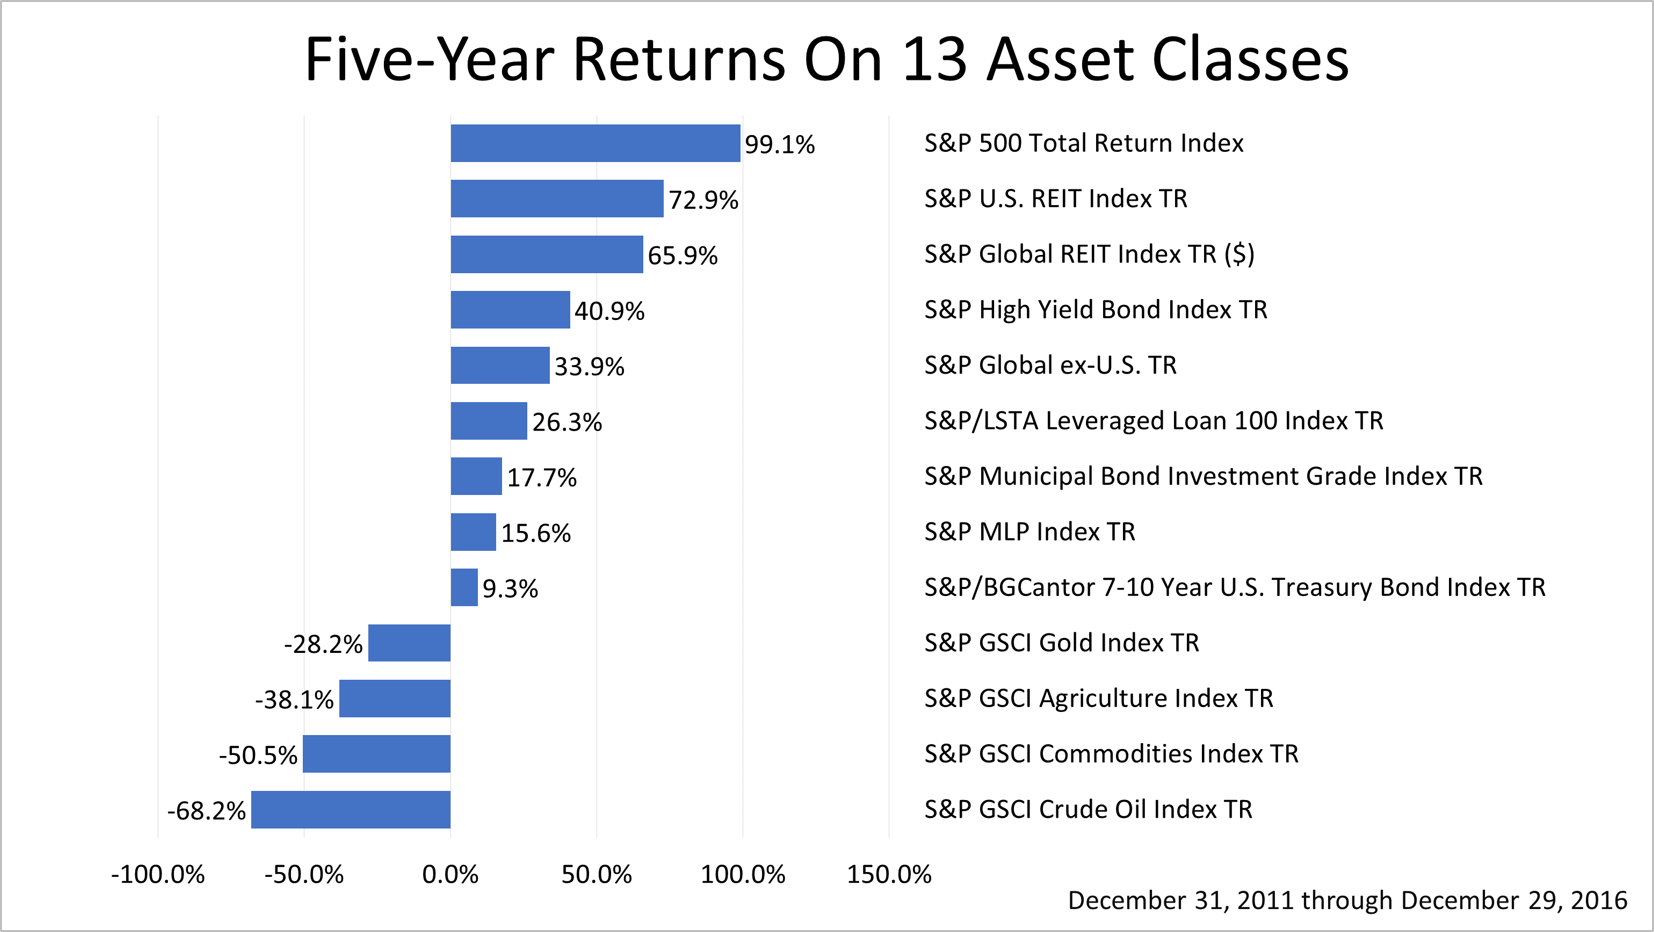 Looking at five years of returns, the Standard & Poor's 500 was No. 1 among the broad sampling of 13 asset classes shown here, hinting at what a heady period this has been for U.S. stocks. Bonds, as represented by the by seven- to 10-year U.S. Treasury index, showed a 9.3% cumulative return over the past five years. That's a tenth of what stocks returned in that same period. Moreover, the next five years will likely be even more unkind to bond investors. Interest rates hit lows not seen in generations in a long cycle of declining interest rates. However, the Federal Reserve raised rates a quarter point in December 2015 and again in December 2016. While rates are widely expected to ratchet higher only gradually for the foreseeable future, a rising rate cycle is under way and it is expected to go on for many years. After an essentially flat finish in 2015, the Standard & Poor's 500 index gained 9.5%. Including dividends, the total return was 11.96%, according to the Associated Press. 2016 was the worst start to any year for U.S. stocks ever, and a couple of major scares occurred during the year. But a steadily improving U.S. economy, declining unemployment, and strong job growth drove corporate profits higher and stock prices rose. Enthusiasm dissipated in the final week of the year, between Christmas and New Year's Day, when locked in profits as they often do at the end of a reporting period. The S&P 500 index closed 2016 at 2,238.83, not far from its all-time peak, reached just two weeks ago. Looking at the bull market through the long-term lens of history, the bull market is old by historical standards, and a drop in stock prices could occur at any time. However, key economic benchmarks are showing none of the signs that normally precede a recession.
With fake news flourishing, we're an independent financial news source not influenced by big media, Wall Street, or politics - a source for prudent analysis about news affecting your wealth over the long run. Please feel free to share our timely weekly reports with your family and friends. We wish you and your family a healthy, happy and prosperous 2017.
This was written by a veteran financial journalist based on data compiled and analyzed by independent economist, Fritz Meyer. While these are sources we believe to be reliable, the information is not intended to be used by as financial advice without consulting a professional about your personal situation. Indices are unmanaged and not available for direct investment. Investments with higher return potential carry greater risk for loss. Past performance is not an indicator of your future results. |  Printer Friendly Version


